
Networking & usage
Networking is often why people buy a ticket, and sponsors ask whether it worked. This report shows how many people on your list actually use the app, and how their meeting invitations turned out. On the day, it also gives the meeting area's desk a printed grid of who meets whom, where and when.
How it works
The five tabs
Open Event Analytics → Networking & Usage. Times are on the event's clock.
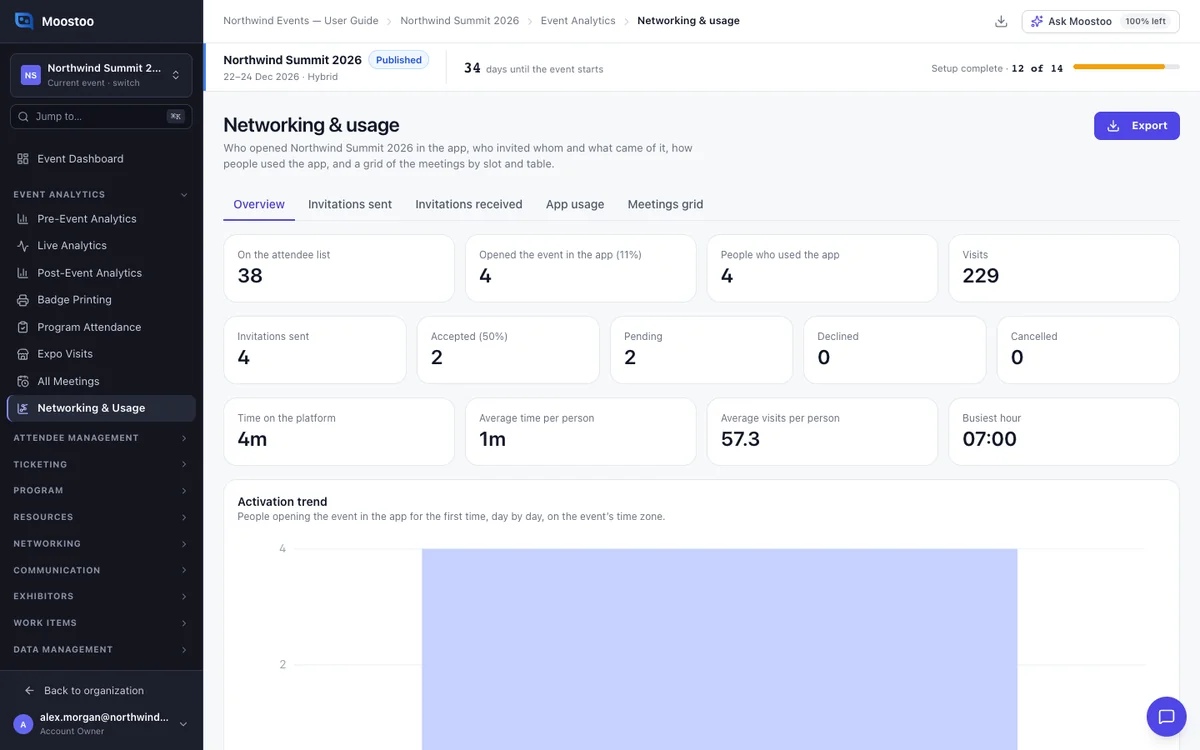
Overview How many people are On the attendee list and how many Opened the event in the app. Invitations sent, with how many were accepted, pending, declined or cancelled. Time on the platform, visits, the busiest hour, and the Activation trend day by day.
Invitations sent One row per person who sent meeting invitations, with what happened to them. Click a row to see each invitation.
Invitations received The same, from the side of the people invited.
App usage One row per person: first opened, visits, time in the app, active days, last seen, and their invitations and meetings.
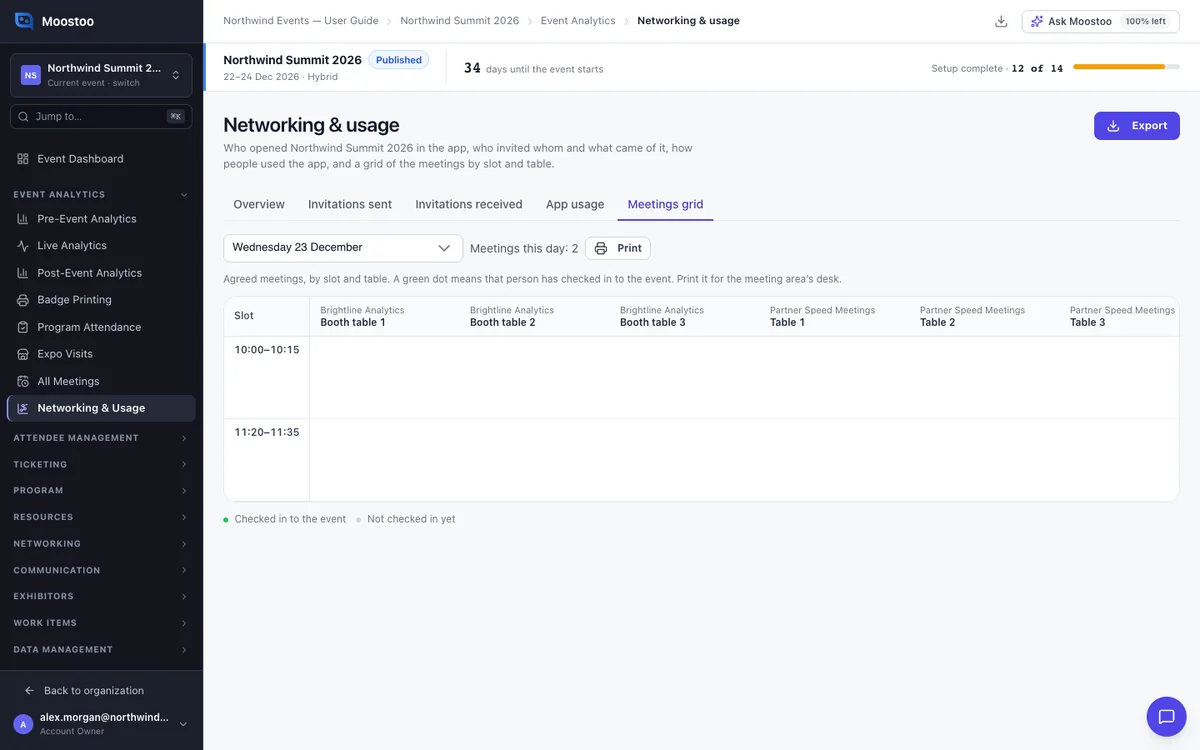
Meetings grid One day's agreed meetings: time slots down the side, tables across the top, plus Online and No table columns. A green dot marks people checked in to the event.
What the figures mean
- Opened the event means the person has opened this event in the attendee app at least once. The gap between the list and this number is who to nudge.
- An invitation is Accepted once the meeting is confirmed. It is Pending while waiting for an answer, including when new times were proposed. It is Cancelled if called off after it was agreed.
- Time in the app counts while the event is open and in front. It can be a little short. Visits from the App Designer preview or while impersonating are not counted.
- The grid shows one physical table as one column, even when several meeting sessions use the same table name. Two meetings at the same table and time appear side by side, so a clash is easy to spot.
Step by step
Follow networking before and during the event
Open Event Analytics → Networking & Usage.
On Overview, compare On the attendee list with Opened the event in the app.
Open App usage and sort by First opened to find who has not started yet.
Search by name or company to look up one person.
Open Invitations sent and Invitations received to see who is active and whose invitations go unanswered.
Print the meetings grid
Open the Meetings grid tab and choose the day.
Click Print and take the sheet to the meeting area's desk.
Export
Click Export.
Choose the Networking & usage report or the Meetings grid (every day), pick CSV or Excel, and click Export.
The grid export has one sheet per meeting day. Both files land in your Downloads.
What attendees see
Attendees do not see this report. The attendee app notes when the event is open, which is how visits and time are known. The exports contain names and companies, so share them only where your privacy terms allow.
Tips
- A low activation rate a week out is the time for a campaign to people who have not opened the app. They cannot receive meeting invitations yet.
- Many pending invitations for one person usually means they are popular but not answering. A reminder, or pre-arranging their meetings, helps.
- The grid shows agreed meetings only. For every meeting with its status and guests, use All meetings.
- The green dot in the grid is the event entrance check-in, not a check-in at the table.