
Event dashboard
The event dashboard is the screen you land on when you open an event. It answers two questions every organizer asks daily: how is registration going, and what is left to do before we can publish. Every number is counted from the event's real data, so the dashboard, the attendee list and the ticketing reports agree with each other.
How it works
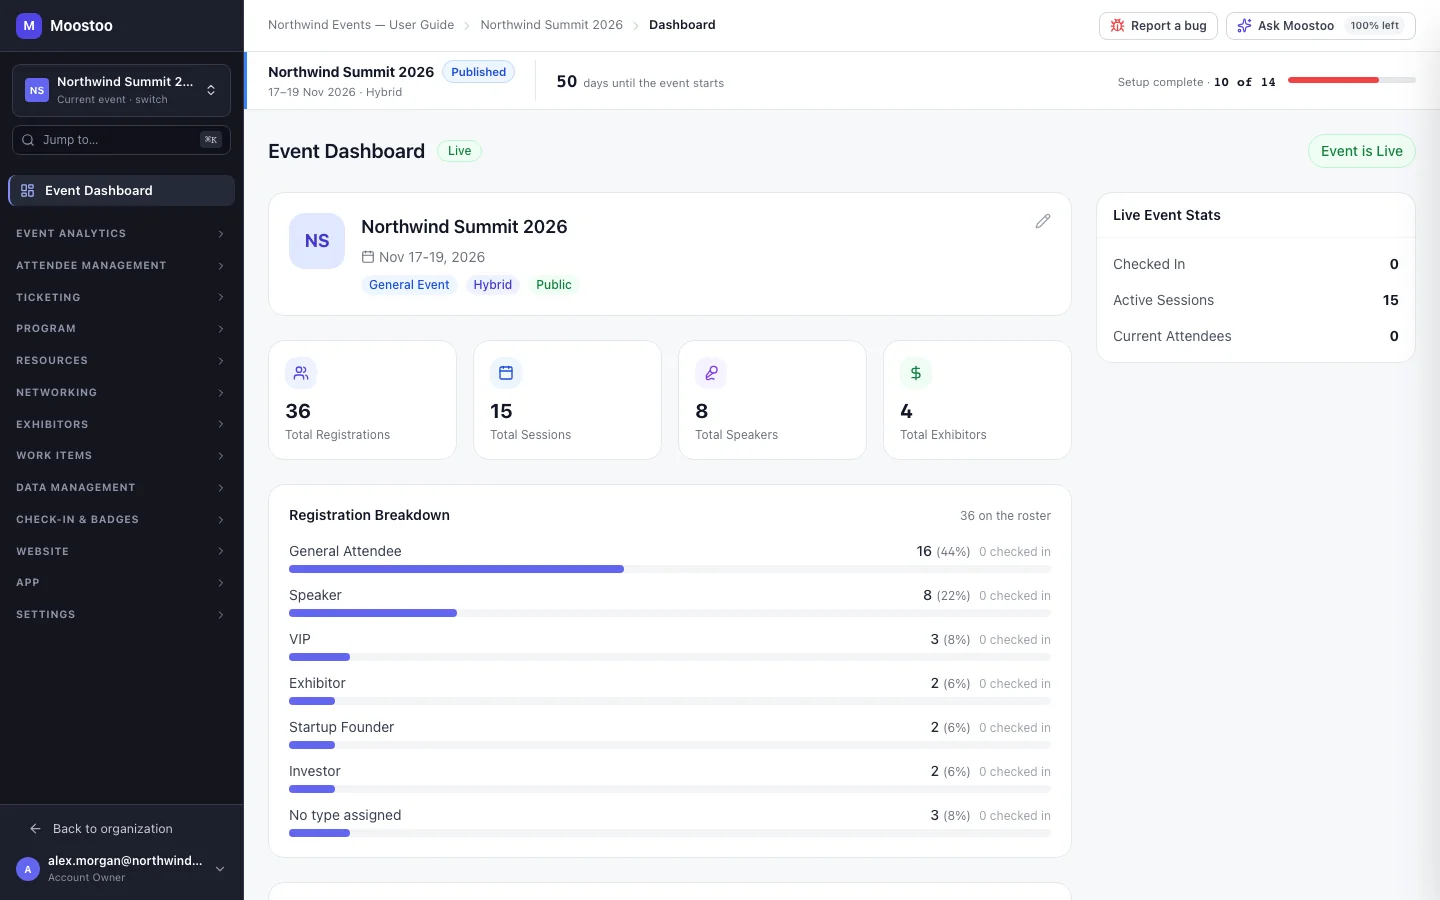
Open an event from Events (or the event switcher at the top of the sidebar) and choose Event Dashboard. The left column is an overview; the right column is the pre-launch checklist, which is replaced by live stats once the event is published.
Identity card The event's name, dates, location (or Online / Hybrid), format and visibility. Click it to open Event settings.
Stat cards Total Registrations, Total Sessions, Total Speakers and Total Exhibitors. Each card opens the matching list. Total Sessions counts the programme only — meeting sessions are not programme content. In the Ticketing & Check-in Console the programme cards are replaced by Checked In.
Registration Breakdown One row per attendee type, in your type order, with how many are registered and checked in and each type's share of the roster. Attendees with no type get their own No type assigned row, so the rows always add up to the total.
Revenue Summary Total Revenue, Tickets Sold and Average Price, from the same figures the ticketing dashboard and the post-event report use. It is hidden for an event that charges nothing and has taken nothing.
Recent Activity Reserved for a feed of recent changes. It currently reads No activity yet.
- Counts exclude deleted attendees, exactly as the attendee directory does by default, so the two never disagree about how many people are coming.
- The status badge beside the title shows Draft until you publish the event and Live from then on — publishing is what makes it live, not its dates, and it stays Live after the last day. Sandbox events also carry a Sandbox badge.
- A brand-new event whose counts are all zero shows No data yet — Start configuring your event to see stats here in place of the stat cards.
Step by step
Check how registration is going
Open the event. The Event Dashboard loads first.
Read Total Registrations for the headline, then Registration Breakdown to see which attendee types are filling up and which are lagging.
Click a stat card to jump to the list behind it — for example Total Registrations opens the attendee directory.
If a No type assigned row appears, open the attendee directory, filter by attendee type and give those people a type — without one they get only the fallback experience rules.
What attendees see
Attendees are not affected: the dashboard only reads your event's data. What it tells you to fix, however — attendee types, the registration form, the website — is exactly what attendees will meet.
Tips
- The breakdown shows each type's share of the roster, not progress against a capacity — attendee types carry no capacity. Use ticket type allocations for limits.
- The checklist refreshes as soon as you save something it checks, such as the registration form; you do not need to reload.
- For money questions go to the ticketing dashboard; for registration trends over time, Pre-event analytics.
Ask Moostoo
Ask Moostoo can answer the same questions from any screen of the event.
How many people have registered so far?
How many VIPs are registered?
Name the attendee type to count only that type.
Show me who has registered.