
Live analytics
On event day you need to see problems before attendees feel them: a queue building at the door, a printer that stopped, a room overflowing while the one next door sits empty. The live dashboard is your operations centre. It updates on its own, raises alerts when something crosses a line, and can fill a large screen in the control room so the whole team watches the same picture.
How it works
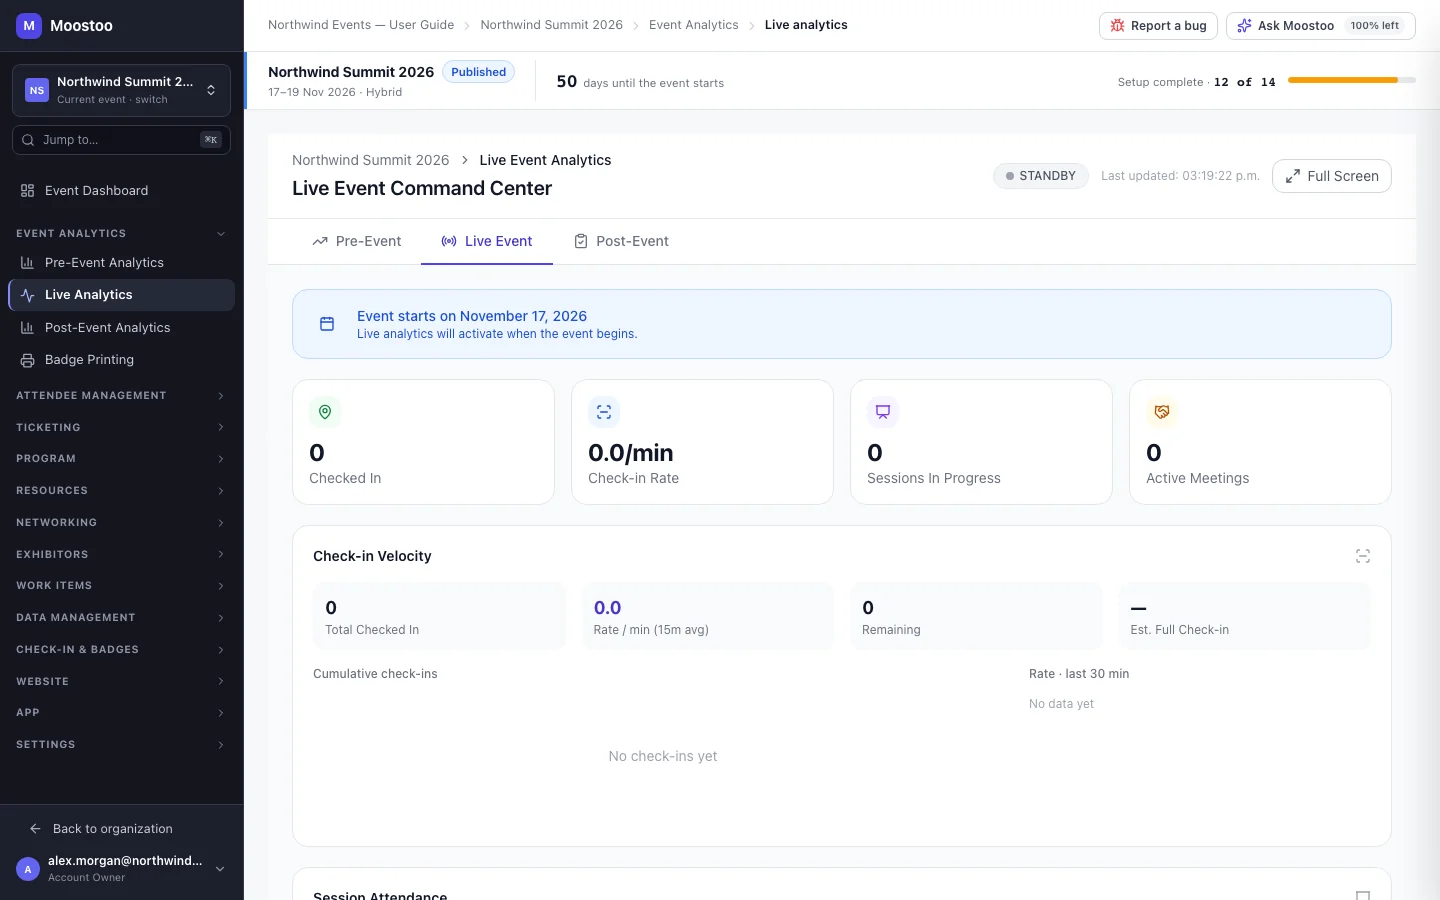
Open Event Analytics → Live Analytics. The page — headed Live Event Command Center — keeps a live connection to Moostoo and also re-reads everything every 20 seconds, so numbers land within half a minute even on a venue network that blocks live connections. Times are shown on the event's clock.
LIVE indicator A pulsing green LIVE means data is current. It turns yellow (Data may be delayed) when the last update is more than 30 seconds old, and shows DISCONNECTED when the connection drops. STANDBY means the event has not started yet.
Connection lost A yellow banner — Connection lost — reconnecting… — says how old the data on screen is and when Moostoo will retry. Retry Now tries straight away. Nothing on screen is cleared while it reconnects.
Before the event A banner reads Event starts on the first day, and the sections show zeros. The page is still listening, so an early check-in at a pre-registration desk appears immediately.
Four tiles across the top give the headline: Checked In, Check-in Rate per minute, Sessions In Progress and Active Meetings. Below them:
| Section | What it shows |
|---|---|
| Check-in Velocity | Total Checked In, the rate per minute (average of the last 15 minutes), Remaining and an estimated time until everyone is in, with a cumulative chart and the last 30 minutes' rate. |
| Session Attendance | A card for every session running now or starting within the hour: room, speaker, attendance against capacity and a fill bar — green under 70%, yellow 70–90%, red over 90%. Click a card for attendance over time and the last 10 check-ins. With nothing running it says when the next session starts. |
| Badge Printing Status | Printed, In Queue and Errors, printed against registered, and each printer with its online status. |
| Session Ratings | Ratings as attendees submit them, with today's average, today's total and the lowest-rated session. |
| Meeting Booking Status | Scheduled, Completed, In Progress, No-Shows and Cancellations, and Hot Matches — the people most requested for meetings. |
| Networking Activity | Active Networkers in the last hour and Connections Made, with connections per 15 minutes. |
| Announcements & Polls | Announcements sent today and their views, active polls and today's responses, and the most recent items. |
| Exhibitor Lead Capture | Exhibitors ranked by leads captured, with the time of each one's latest capture. |
| Operations Alerts | Problems Moostoo has spotted, newest first. |
| Alert | Severity | Raised when |
|---|---|---|
| Room at N% capacity | Red | A running session's room is more than 95% full. |
| Printer offline | Red | A badge printer stops responding. |
| Check-in rate dropped | Yellow | Arrivals fell by more than half over the last 15 minutes. |
| Low attendance | Yellow | A session that has started has under 10% of its capacity in the room. |
| High meeting no-show rate | Yellow | More than 30% of scheduled meetings were missed. |
In the Ticketing & Check-in Console
The console runs the door, not a programme, so it shows check-in velocity, badge printing, announcements and operations alerts. The session, ratings, meeting, networking and exhibitor panels — and the Sessions In Progress and Active Meetings tiles — are not shown.
Step by step
Run the control-room screen
Open Event Analytics → Live Analytics on the computer that drives the big screen.
Click Full Screen.
The dashboard fills the display with larger text and no sidebar. Exit Full Screen or the Esc key returns to the normal view.
Watch the LIVE indicator. If it turns yellow or shows DISCONNECTED, check the venue network — the numbers on screen are the last ones received.
When an alert appears, act on it — send a volunteer to the overflowing room, restart the printer — then click Dismiss.
Dismissed alerts move to a collapsed dismissed alerts list beneath, so the team can see what has already been handled.
Click a red session card to see how fast the room filled and who checked in last, before deciding whether to open an overflow room.
What attendees see
Attendees are not affected — this is an organizer-only view and nothing on it changes what attendees see. What it reports comes from what attendees and your team do: check-ins at the door and in sessions, badges printed, ratings submitted, meetings booked and held, and leads exhibitors scan.
Tips
- Room fill only means something when sessions have a capacity. A session without one shows a dash instead of a percentage and never raises a capacity alert — set capacities on your locations or sessions.
- Session attendance counts session check-ins. If nobody scans at room doors, see Session check-in — otherwise every room reads empty and low-attendance alerts fire.
- Dismissing an alert hides it for the team, but a condition that is still true (a printer still offline) is not fixed by dismissing it.
- Messages Sent and QR Scans in Networking Activity always read zero for now — those two are not counted yet.
- For the full print history after the doors close, use the badge printing report.