
Organization analytics
One event's report tells you how that event went; it cannot tell you whether you are getting better. Organization analytics lines up every event your organization has run so you can spot trends — a check-in rate that keeps slipping, a ticket type that has quietly become your main revenue, an audience that is shifting from attendees to exhibitors — and plan next year's calendar from evidence rather than memory.
How it works
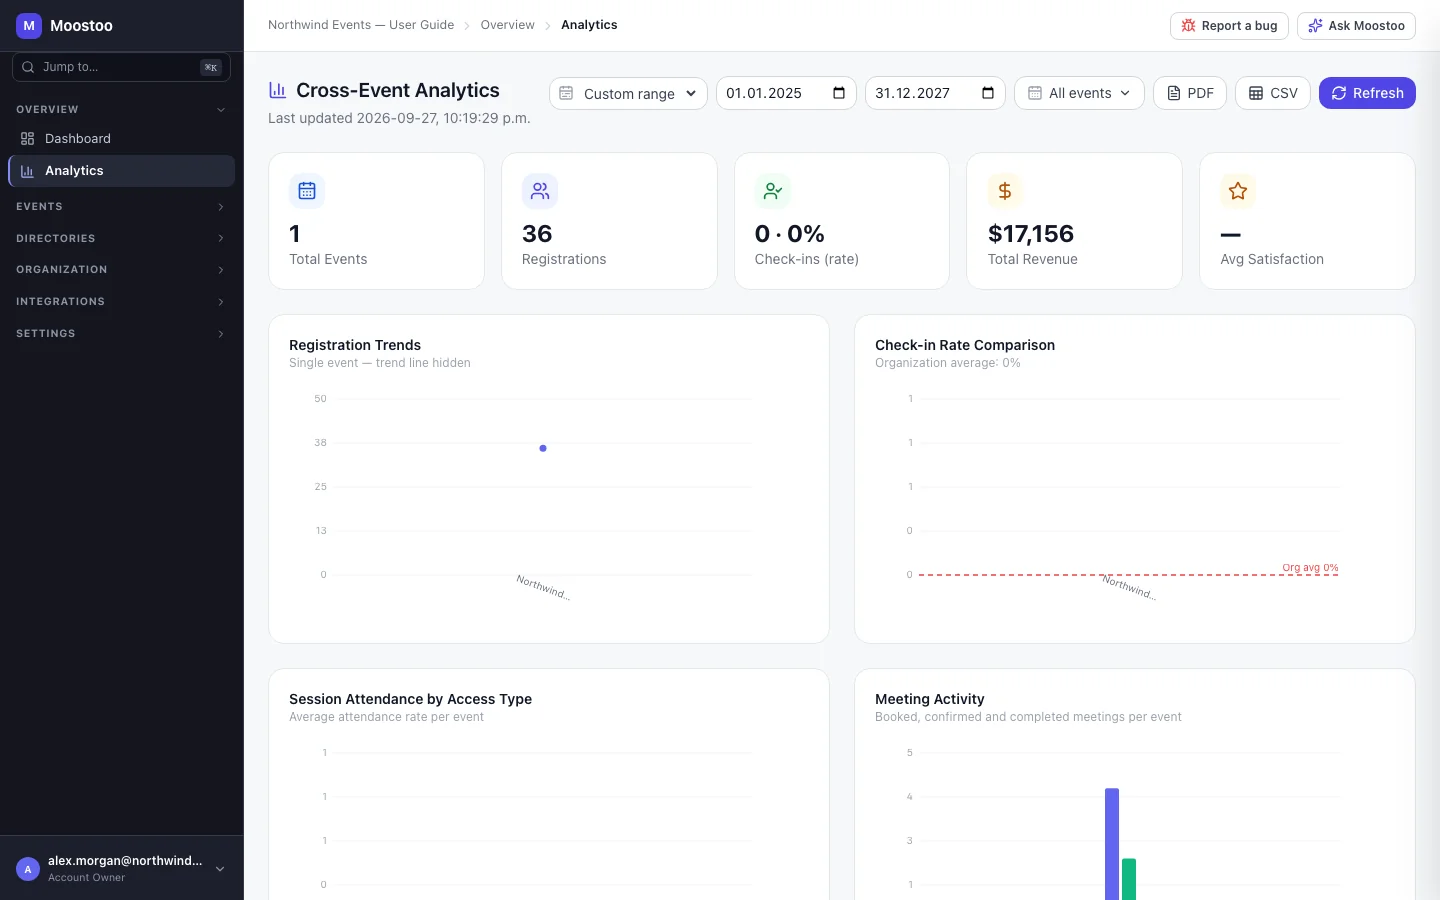
Open Analytics under Overview in the organization sidebar (outside any event). The page, Cross-Event Analytics, covers every event of the organization that has not been deleted. Account Owners, Super Users and Users can open it; Volunteers and Partners cannot.
Two filters decide what is counted: a date range — Last 12 months (the default), Last 6 months, Last 30 days or Custom range — and an event picker (All events, or tick the ones you want to compare). Every card, chart and table below follows both filters.
| Part | What it shows |
|---|---|
| Summary cards | Total Events, Registrations, Check-ins with the overall check-in rate, Total Revenue and Avg Satisfaction (from session ratings, out of 5). |
| Registration Trends | Registrations per event in date order, with a trend line once there is more than one event. |
| Check-in Rate Comparison | Each event's check-in rate against a line for the organization average. |
| Session Attendance by Access Type | Average session attendance per event, split by access type (Open, RSVP, Invite only…). |
| Meeting Activity | Meetings booked, confirmed and completed per event. |
| Revenue Breakdown by Ticket Type | Revenue per event split by ticket type, and a Revenue Summary table with gross, refunds and net. |
| Attendee Type Distribution | How many of each attendee type each event had — how your audience mix changes over time. |
| Cross-Event Benchmarking | One row per event: Dates, Registrations, Check-in %, Sessions, Avg Attendance %, Meetings, Revenue and Satisfaction. Click a column heading to sort; click a row to open that event's post-event report. With more than 25 events it pages 25 rows at a time. |
Snapshot The figures are gathered into a snapshot rather than recounted on every visit; Last updated under the title says when. A snapshot older than a day is rebuilt automatically when you open the page.
Refresh Rebuilds the snapshot now — use it right after an event ends or an import lands. It can be used once every 10 minutes; hovering the button while it is unavailable says when it will be available again.
Step by step
Compare a set of events
In the organization sidebar, open Overview → Analytics.
Choose the date range. For Custom range, pick a start and an end date.
Click All events and tick the events you want to compare — for example this year's and last year's edition of the same conference.
Select all events at the top of the list goes back to every event.
Read the charts, then sort Cross-Event Benchmarking by the column you care about.

Click PDF or CSV to take the comparison with you.
The PDF option downloads a report page that opens your browser's print dialog — choose Save as PDF. For a very large selection (more than 50 events) the PDF is not downloaded and a message says it is being generated; use CSV instead.
Click a row to open that event's post-event report for the detail behind a number.
What attendees see
Attendees are not affected — this is an organizer-only view built from your events' registrations, check-ins, sessions, meetings and orders. Nothing here is shown to attendees or sent to them.
Tips
- Revenue is shown in one currency. If your events sell in different currencies, compare revenue per event in each event's own ticketing dashboard instead.
- Sandbox and draft events count too while they exist. Untick them in the event picker so demo data does not skew your averages — or delete demo events you no longer need.
- Check-in rates are only comparable between events that actually scanned at the door. An event that did not use check-in reads 0% and drags the organization average down.
- A satisfaction score appears only for events whose attendees rated sessions.
Ask Moostoo
Ask Moostoo to list your events before you pick which ones to compare.
Which events do we have this year?
List our events so I can choose one to look at.