
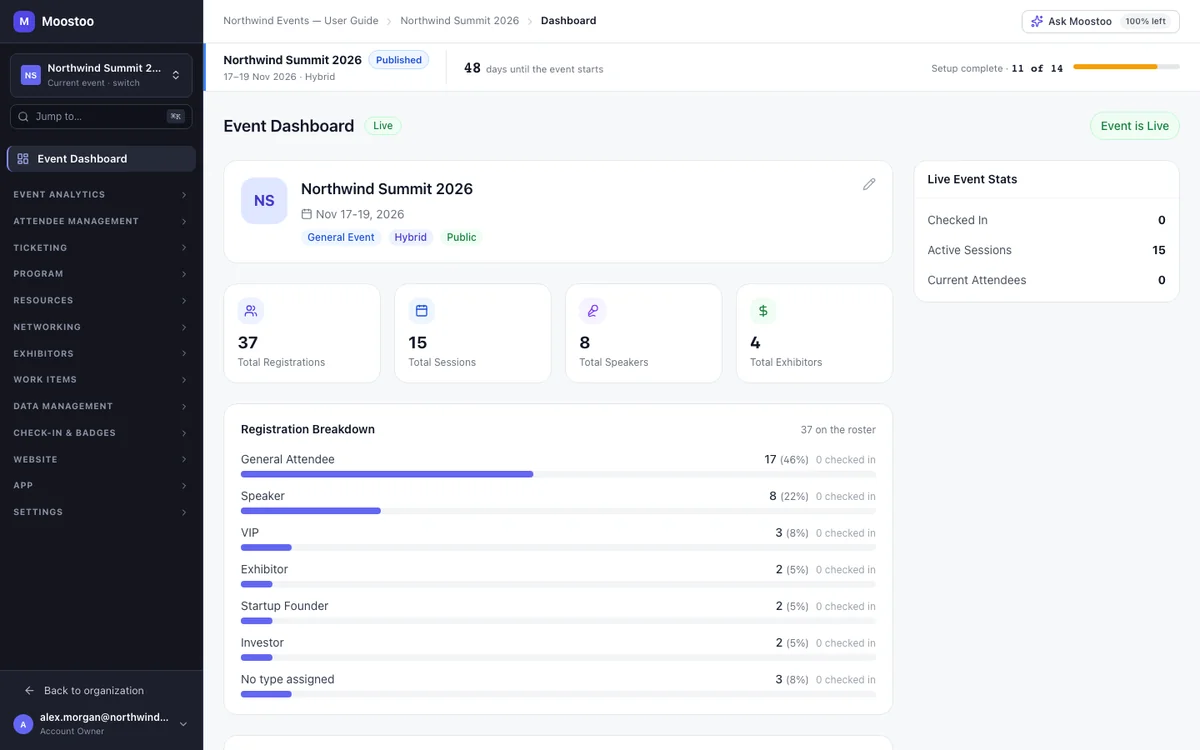
Pre-event, live and post-event, a click apart.
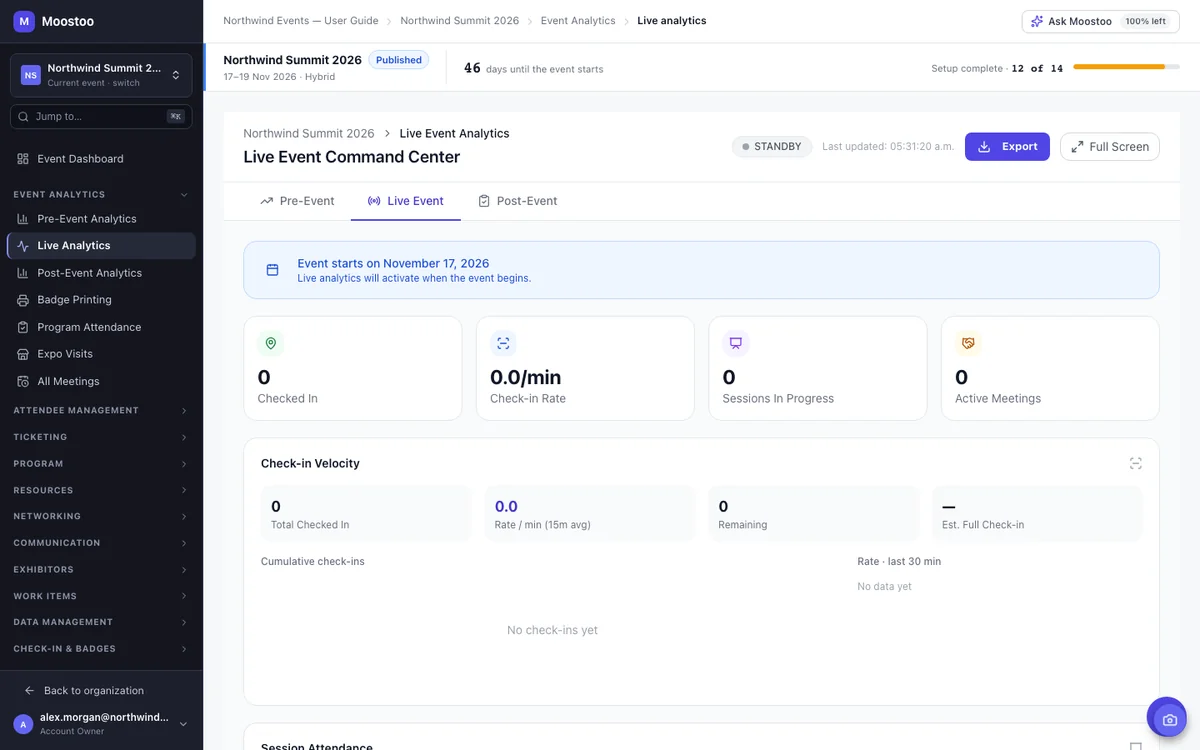
The live command center re-reads everything every 20 seconds.
From the scorecard to sponsor ROI and benchmarking.
PDF, Excel and CSV, covering every attendee.
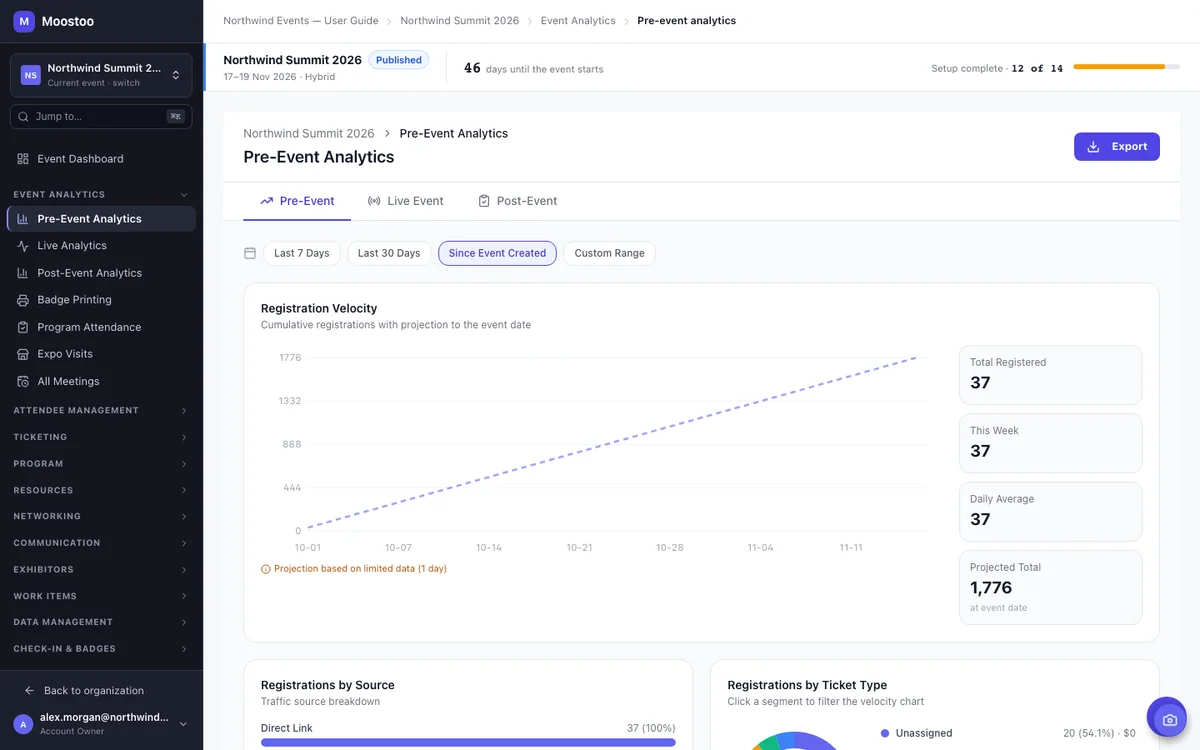
In the weeks before an event the questions are always the same: are we on track, which channel is working, which ticket is selling, and will people be ready to network when they arrive? The pre-event dashboard answers them from your live registration data, with a projection of where registrations will land by the event date, so you can move budget to the channel that converts and push the ticket that lags.
On the day, you want to spot problems before attendees feel them: a queue building at the door, a printer that stopped, a room overflowing while the one next door sits empty. The live command center shows arrivals per minute and how many are still to come, every session's fill against capacity, badge printing, meetings, networking, exhibitor leads and operations alerts, updating by itself.
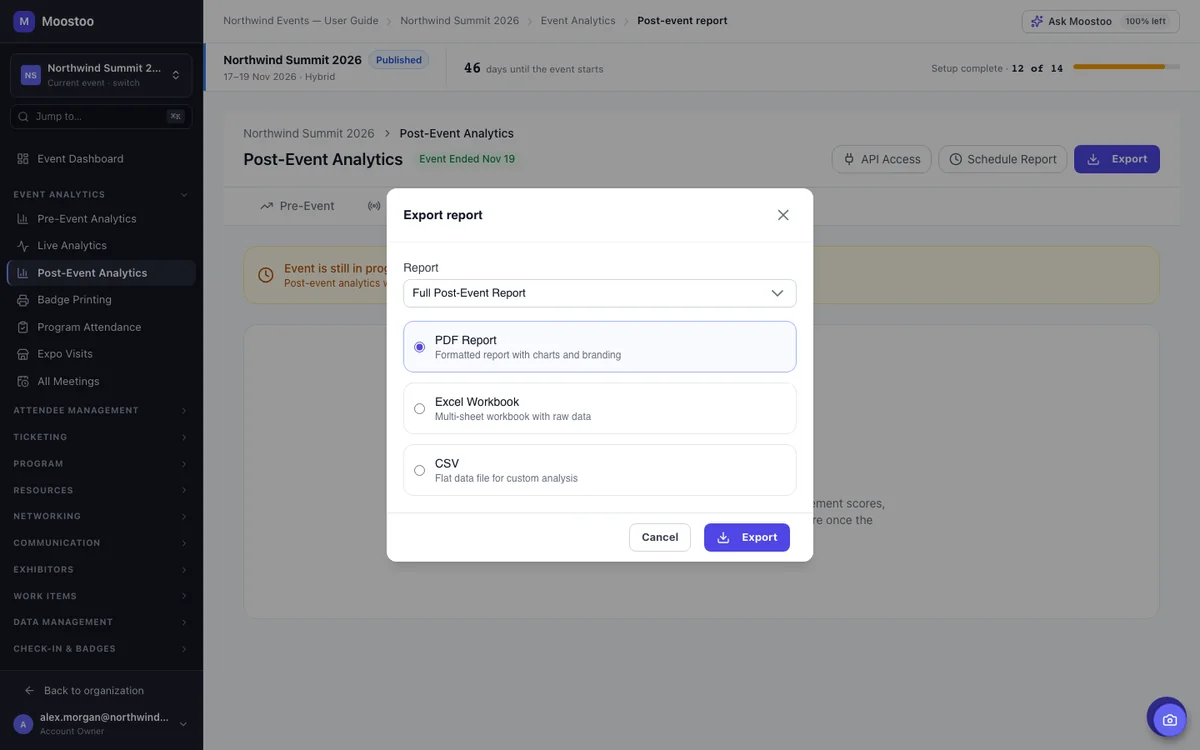
After the event you owe answers: to leadership (did it work?), to sponsors (was it worth it?), to speakers (how did you do?) and to yourself (what changes next year?). The post-event report gathers them in seven tabs, scores the event out of 100 and every attendee by engagement, and exports to files you can hand to people who never log in to Moostoo.
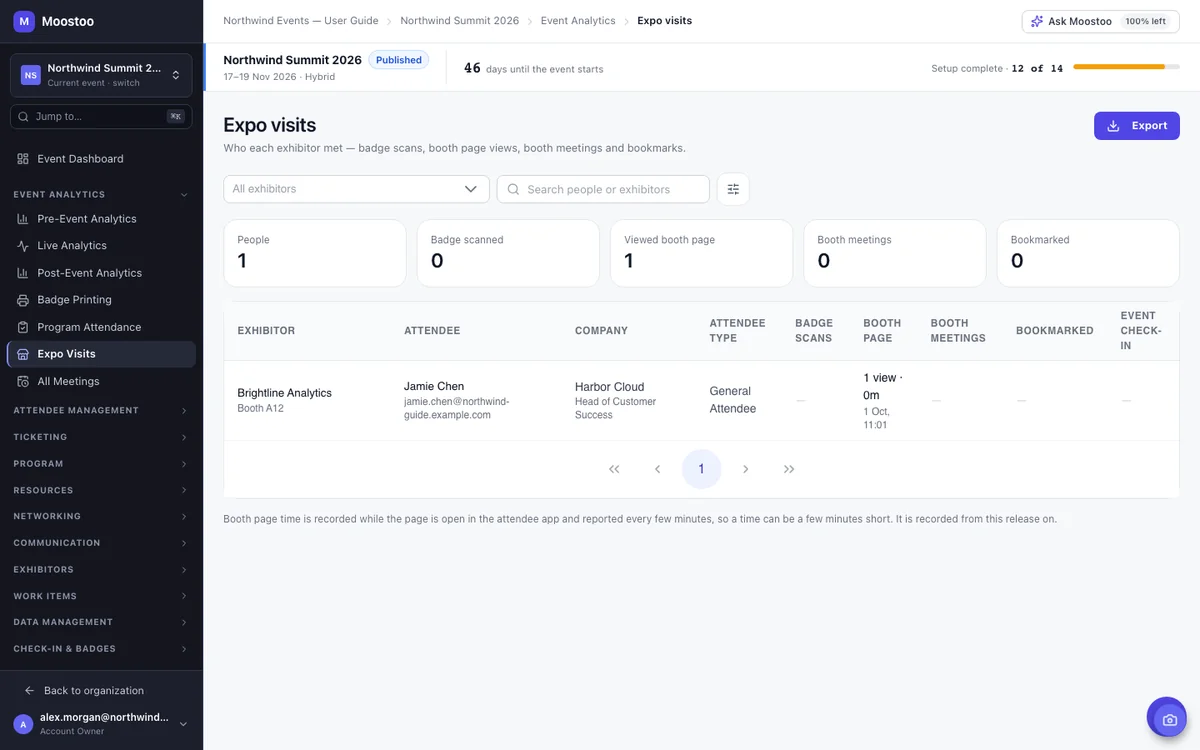
A session's headcount doesn't tell you who came. Program attendance lists every person against every session they saved, checked in to or watched online, with each kind of evidence in its own column. Someone who saved a talk and never came is on the list too, which is often the most useful row. Expo visits does the same for exhibitors: badge scans, booth page views, meetings and bookmarks, side by side.
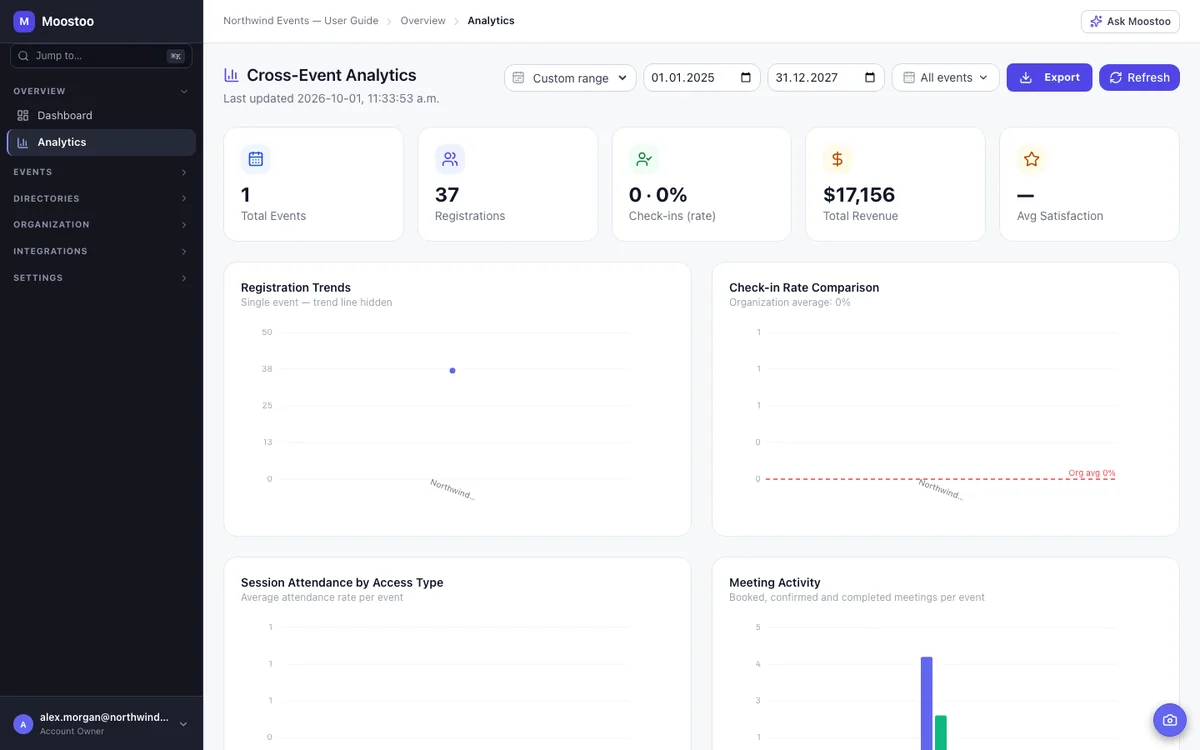
One event's report tells you how it went. It can't tell you whether you're getting better. Cross-event analytics, part of the Association & Portfolio plan, lines up every event your organization has run: registrations, check-in rates, session attendance, meetings, revenue by ticket type and how your audience mix changes over time. Plan next year's calendar from evidence instead of memory.
The right event KPIs change with the stage of the event. Here's where to find the answer to each question organizers ask most, so you're not hunting through reports when someone needs a number.
| The Question | Where in Moostoo | When |
|---|---|---|
| Are registrations on track? | Pre-event analytics | Weeks before |
| Which channel brings registrants? | Registrations by source | During promotion |
| Is the door coping? | Live command center | On the day |
| Which rooms were too small? | Session attendance and capacity fill | During and after |
| Was it worth it for sponsors? | Expo visits and the ROI summary | After |
| Are our events getting better? | Post-event benchmarking, or cross-event analytics on Association & Portfolio | Between events |
Want a deeper look at turning these numbers into a better return? Read our guide to using data to improve event ROI.
Pre-event and live analytics come with every plan. The post-event report comes with the plans built for full events, and cross-event analytics with the plan built for many of them.
Every plan: pre-event and live analytics and the badge printing report. Event App and Corporate add the post-event report with sponsor ROI, program attendance and expo visits.
Everything in Corporate, plus cross-event analytics: benchmarking across every event your organization has run, so you can compare chapters, editions and formats side by side.
Compare the plans, see how event check-in feeds the live numbers, or how exhibitors and sponsors get their results.
Connect Google Analytics 4 to send registration-funnel events to your own property, sync attendees and their activity to HubSpot or Salesforce, or push live data to Google Sheets. Measurement follows each visitor's cookie choice.
Pick Canada (Montréal) or the EU (Frankfurt) when you set up your organization. Analytics, the records behind them and the AI features all stay in that region, backups included. That's one clear answer for your legal team.
Five steps, and no tracking codes or spreadsheets to maintain.
Registration, check-in, sessions, meetings and exhibitors feed the analytics as they happen. There's nothing extra to track.
Check the pre-event dashboard each week and act on the channel or ticket that lags.
Put live analytics on a big screen and watch arrivals, rooms and printers.
Give late check-ins and ratings two hours to arrive, then review the scores and set your lead value.
Export PDFs for leadership and sponsors, and compare the event with the ones before it.
Event analytics is the measurement of how an event performs: registrations and where they come from, attendance at the door and in each session, networking, exhibitor engagement and the overall result. In Moostoo, event analytics come from the same records you use to run the event, before, during and after it.
Attendance against registrations, session attendance and ratings, speaker performance, networking activity, exhibitor and sponsor results, and how the event compares with previous ones. Moostoo's post-event report covers all of these in seven tabs and adds an overall Event Health Score.
Yes. The live command center shows arrivals per minute, sessions filling up, badge printing, meetings, exhibitor leads and operations alerts, and updates itself.
Use Expo Visits to show every attendee who scanned at, viewed, met or bookmarked an exhibitor, and the post-event report's ROI summary, which compares each company's investment with the estimated value of its leads. Both export as files you can send.
Yes. The post-event report compares an event with up to five of your other completed events, and on the Association & Portfolio plan, cross-event analytics lines up every event your organization has run.
PDF reports, Excel workbooks with one sheet per section, and CSV files. Exports cover every attendee, including the ones on pages you haven't opened.
Yes. The Google Analytics 4 connector sends registration-funnel events to your own GA4 property, following each visitor's cookie choice.
A few, and Moostoo says so. Registrations by source are shared out from tracked visits, and the middle steps of the registration funnel are estimated between page views and confirmed registrations. Everything else is counted from real records.
Last updated October 2026. Product details are taken from the Moostoo Admin Guide.