
Pre-event analytics
In the weeks before an event the questions are always the same: are we on track, which channel is working, which ticket is selling, and are people ready to network when they arrive? This dashboard answers them from your live registration data, so you can move budget to the channel that converts, push the ticket that lags, and nudge attendees with thin profiles while there is still time for matchmaking to use what they write.
How it works
Open Event Analytics → Pre-Event Analytics in the event's sidebar. The page reads your registrations, ticket types, orders and attendee profiles each time it loads — there is nothing to set up and nothing to refresh by hand. The three tabs at the top (Pre-Event, Live Event, Post-Event) move between the three analytics screens of the same event. In the Ticketing & Check-in Console the Post-Event tab is still shown, but the post-event report is not part of that edition.
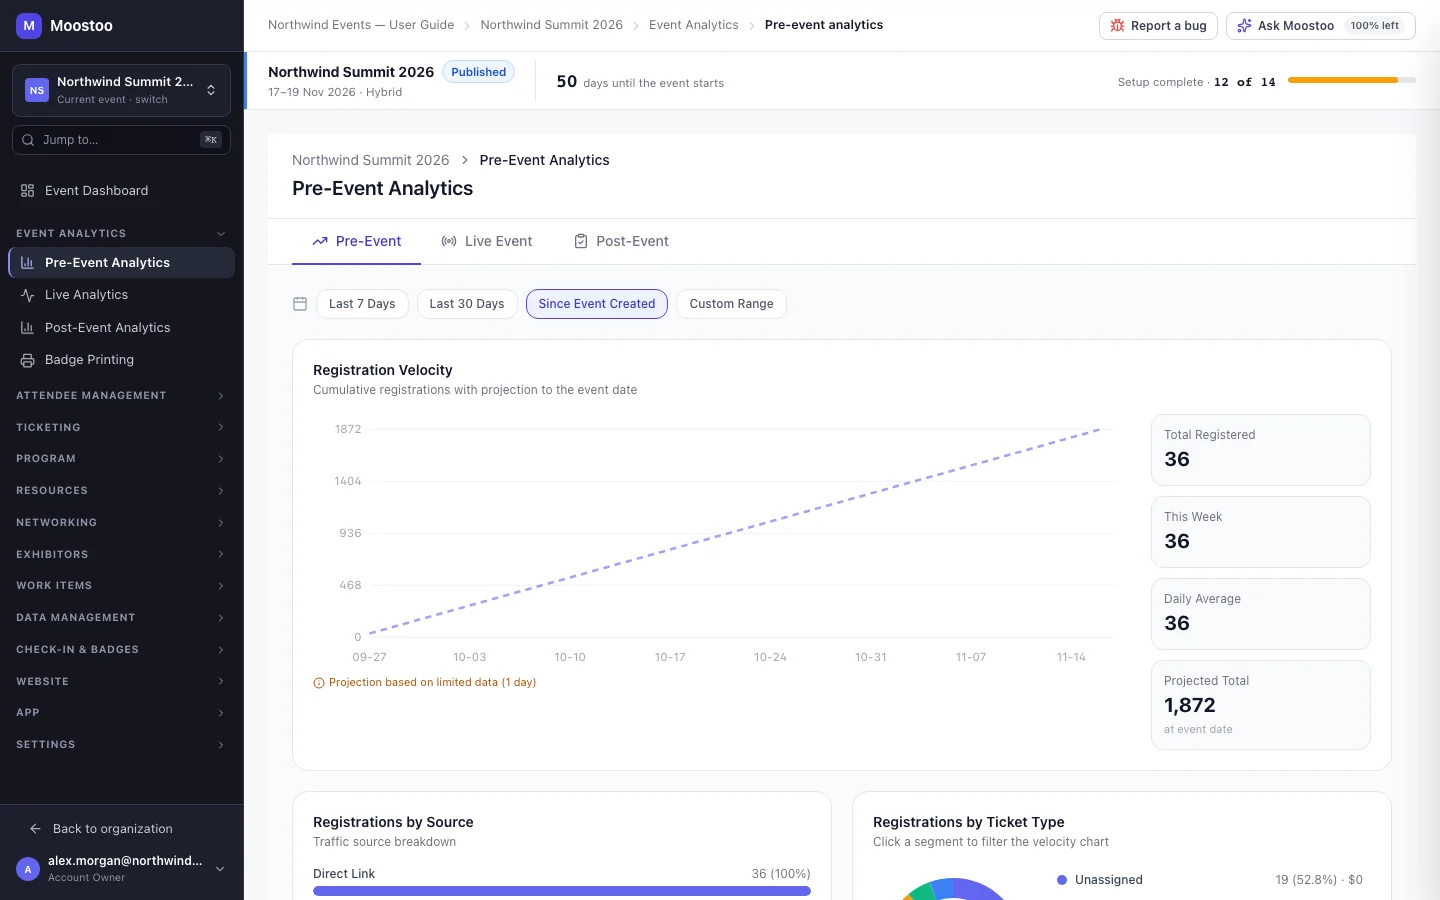
A date range at the top — Last 7 Days, Last 30 Days, Since Event Created (the default) or Custom Range — narrows the time-based sections. Days are the event's days: a registration is counted on the day it happened on the event's clock, not on your computer's, so an organizer in another timezone sees the same daily bars as the team at the venue.
| Section | What it tells you |
|---|---|
| Registration Velocity | Cumulative registrations over time with a dashed projection to the event's start date, plus Total Registered, This Week, Daily Average and Projected Total. The projection extends your last seven days' pace (or all the data you have, if there is less). |
| Registrations by Source | Where registrants came from — Direct Link, Social Media, Email Campaign, Referral, Embedded Widget or Other. Moostoo records where each visit to your registration page came from and shares the registrations out in the same proportions, so read it as a mix, not as a record of each person. With no tracked visits, everything reads Direct Link. |
| Registrations by Ticket Type | How registrations split across your ticket types, with each type's revenue. Click a slice to filter the velocity chart to that ticket type; click it again to clear the filter. |
| Registrations by Attendee Type | How registrants split across your attendee types. |
| Revenue Tracking | Cumulative revenue, revenue per ticket type, Total Revenue, This Week and Average Price. A free event says revenue tracking is not applicable instead. |
| Dropout & Recovery | The registration funnel — Page Views, Form Started, Form Completed, Payment Completed (paid events only), Confirmed — and abandoned-cart figures. |
| Geographic Distribution | Registrants by Country or City (toggle in the corner), with a density bar and a share for each. |
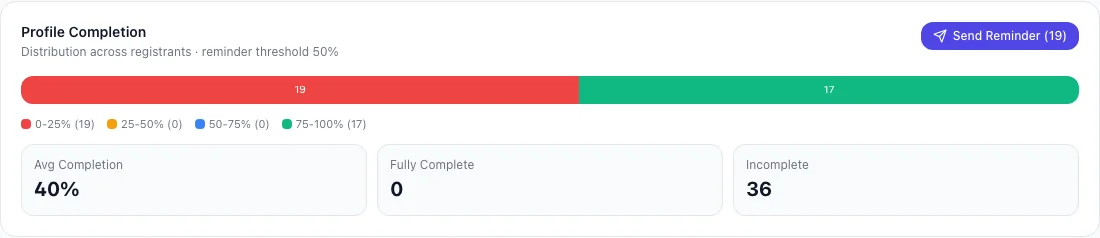
| Profile Completion | How complete registrants' networking profiles are, in four bands, with the average and the fully complete / incomplete counts — and a Send Reminder button. |
Where a location comes from Each attendee counts once, from their own Country and City — the fields on the attendee record, filled from the Add/Edit form, an import, the ticketing mapping console or the attendee's own profile. Only an attendee who gave neither falls back to the billing address of the order their ticket came from. A country is grouped whatever it was typed as ("Turkey", "Türkiye" and "TR" are one row) and a city is grouped with its country, so Paris, France and Paris, United States stay apart.
Limited data When some registrants have no location at all, the section says what share is missing. Collect Country and City on the profile form or map them in your import to close the gap.
Reminder threshold Send Reminder emails every registrant whose profile is at or below 50% complete, with a link straight to their profile in the attendee app. The button shows how many people that is and is disabled when nobody is below the line.
Read the funnel as an estimate
Page views and confirmed registrations are real. Form Started and Form Completed, and the recovery figures (Recovery Emails, Recovered, Recovery Rate), are estimated between those two anchors — they are not individually tracked yet. Use the funnel to see the overall drop from visit to registration, not to judge a single step.
Step by step
Check registration and nudge incomplete profiles
Open Event Analytics → Pre-Event Analytics.
Pick a date range — Last 7 Days to judge a campaign that just went out, Since Event Created for the whole story, or Custom Range and two dates.
Compare Projected Total with your capacity. If the projection falls short, look at Registrations by Source to see which channel is carrying the event.
Click a ticket type in the donut to see that ticket's own pace in the velocity chart.
The chart's heading names the filter; clear it from there or by clicking the slice again.
In Geographic Distribution, switch between Country and City to plan travel information, hotel blocks or timezone-friendly online sessions.
In Profile Completion, click Send Reminder (N) to email everyone at or below 50%.
A confirmation says how many reminders were sent. Each click sends again to everyone still below the line, so space reminders out.
What attendees see
Attendees are not affected by looking at this dashboard — none of it is visible to them. The one exception is Send Reminder: every registrant at or below 50% profile completion receives a short email, Complete your profile for your event, with a button that opens their profile in the attendee app. Outside production, the platform's delivery rules still apply to it like any other email.
Tips
- An event with no registrations shows No registrations yet and an Open event page link — share that registration address to get started.
- The projection is a straight extension of recent pace. A campaign, a price change or the last week before the event will bend the real line — re-check after each.
- Source attribution depends on how people reached you. Tag the links you post in newsletters and on social media so visits are classified as Email Campaign or Social Media rather than Direct Link.
- Profile completeness feeds matchmaking quality. A reminder a week or two before the event gives AI matchmaking more to work with than one sent the night before.
- For a quick count of who has registered, the event dashboard and, for paid events, the ticketing dashboard show the same roster from a different angle.
Ask Moostoo
Ask Moostoo can give you the headline numbers without opening the dashboard.
How many people have registered for Northwind Summit so far?
Break down registrations by attendee type.
How many VIPs are on the attendee list?