
Post-event report
After the event you owe answers: to your leadership (did it work?), to sponsors (was it worth it?), to speakers (how were you rated?) and to yourself (what do we change next year?). The post-event report gathers those answers in one place, scores the event and every attendee, and turns them into files you can hand to people who never log in to Moostoo.
How it works
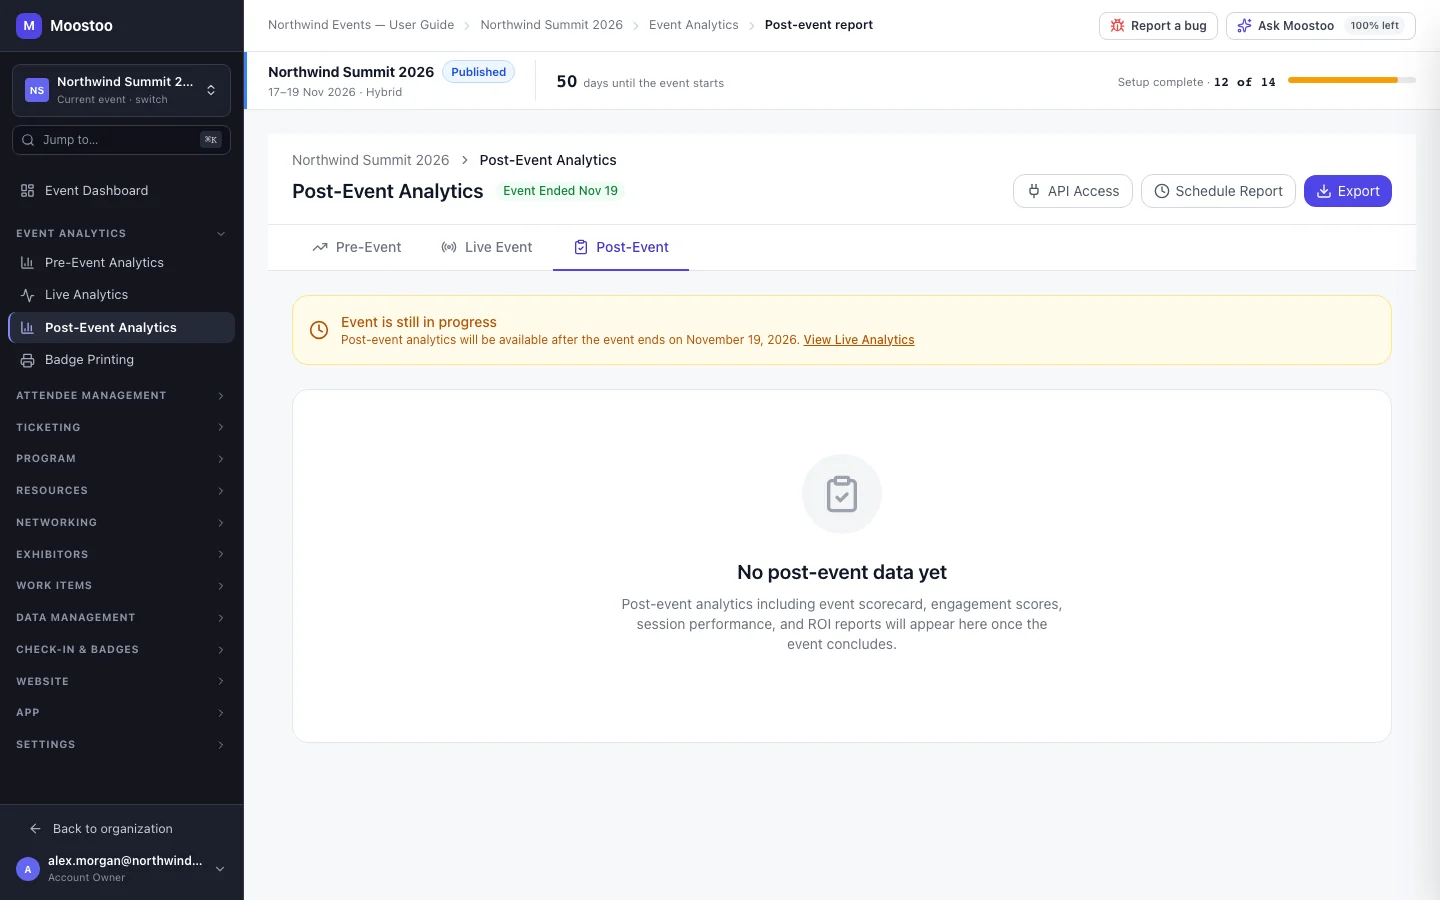
Open Event Analytics → Post-Event Analytics. While the event is still running the page says Event is still in progress and shows no data. For the first two hours after the event ends it opens with Data is still being finalized — late check-ins and ratings are still arriving, so treat the numbers as provisional. After that the report is complete.
| Tab | What it holds |
|---|---|
| Scorecard | The one-page summary: an Event Health Score (0–100), Total Attendance against registrations, Sessions Held, Total Revenue net of refunds, average session rating, meetings held and their completion rate, leads captured, connections made, and highlights such as the top-rated and most-attended session. |
| Attendees | Every attendee with sessions attended, meetings, connections, profile completeness and an Engagement Score; filter by score range, attendee type or ticket type, sort by any score column, and click a row for that person's breakdown. |
| Sessions | Every session with speaker, attendance, capacity fill, average rating, number of reviews and drop-off (people who left before the end). Click a session for its detail. |
| Speakers | Each speaker's sessions, average rating, total attendees and a Repeat Invite verdict. |
| Networking | Total meetings, completion rate, meetings per person, connections made and messages exchanged, Meetings by Time Slot (which slots were busiest) and a heatmap of which attendee types connected with which. |
| Exhibitors & Sponsors | Booth visits, leads, meetings, page views and engagement per company, and an ROI Summary comparing each company's investment with the estimated value of its leads. |
| Benchmarking | This event side by side with up to five of your other completed events — attendance, attendance rate, rating, revenue and connections — with a trend. It needs at least two completed events. |
Event Health Score A weighted mix of attendance rate (30%), average session rating (30%), meeting completion rate (20%) and profile completion rate (20%).
Engagement Score Per attendee: sessions attended (25%), meetings completed (25%), networking activity (20%), profile completeness (15%) and polls & surveys (15%). A score built from incomplete data — someone who never checked in, say — is marked Partial.
Lead value multiplier The ROI Summary values each lead at a figure you can change on the tab (150 by default). It only changes the estimate you are looking at; nothing is stored.
Exports
Export asks for a report and a format. Each report contains the section it is named after — Event Scorecard, Attendee Engagement, Session Performance or Exhibitor & Sponsor ROI — and Full Post-Event Report contains every tab, speakers and networking included. Exports cover every attendee, not the page of fifty you are looking at, and carry each attendee's job title and company.
| Format | What you get |
|---|---|
| PDF Report | A formatted report page. It opens your browser's print dialog when you open it — choose Save as PDF to keep a PDF. |
| Excel Workbook | A workbook with one sheet per section, for further analysis. |
| CSV | A flat file for your own tools or a BI import. |
Step by step
Export a report for your stakeholders
Open Event Analytics → Post-Event Analytics once the event has ended.
Read the Scorecard. To hand it on as it is, click Export Scorecard as PDF at the bottom.
For anything else, click Export at the top right.
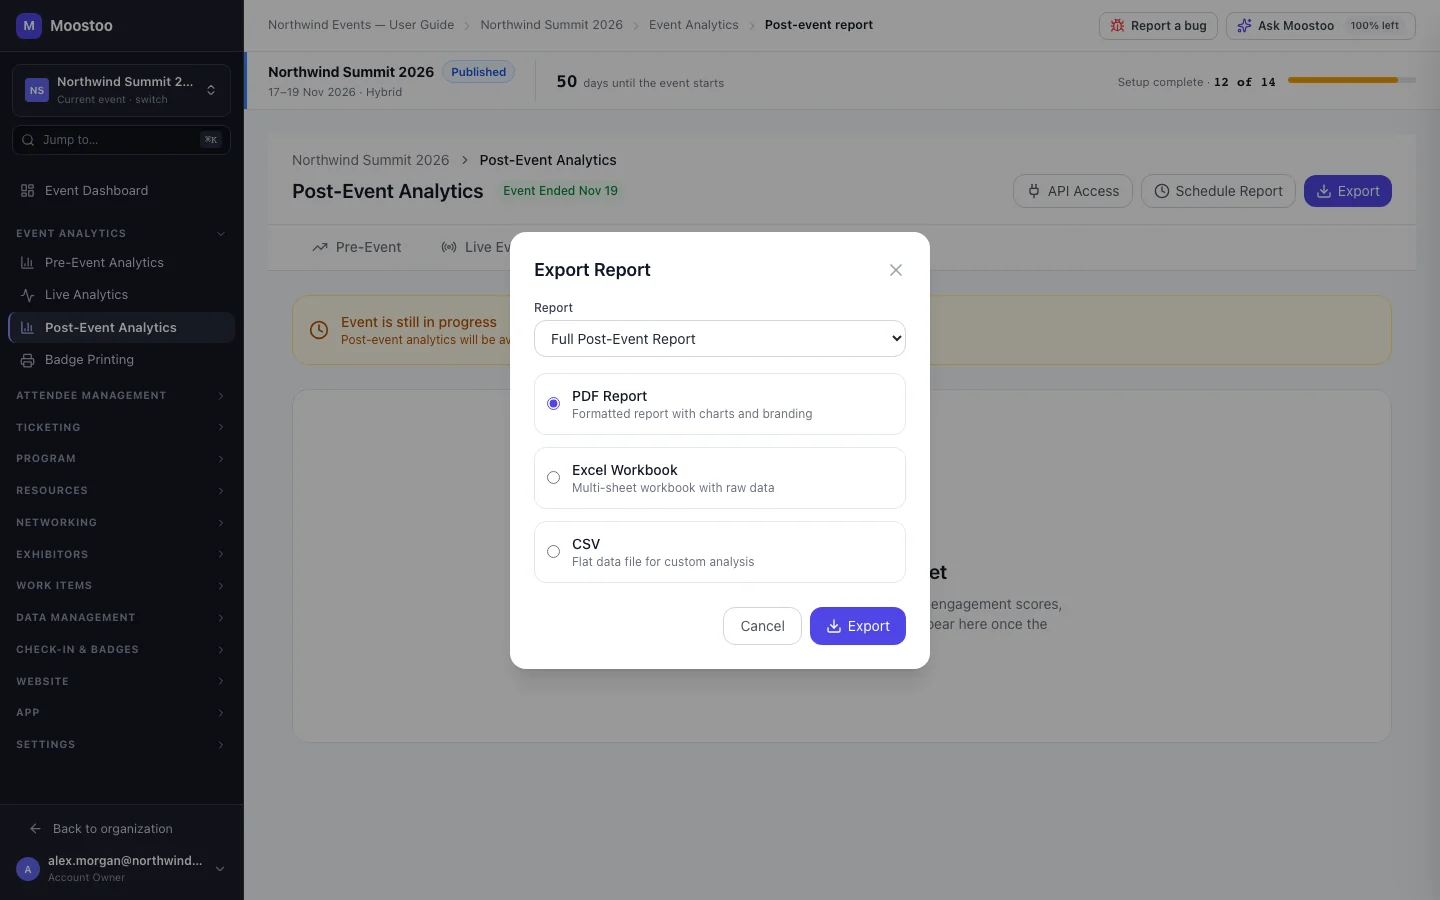
Choose the Report — the section your reader cares about, or Full Post-Event Report — and the format, then click Export.
The file downloads straight away. A PDF of a very large event (thousands of attendees) is not downloaded; the message says it will be sent by email — use Excel or CSV for those.
Before sending sponsors their numbers, open Exhibitors & Sponsors and set the Lead Value Multiplier to what a lead is worth in your market.
To give a BI tool (Tableau, Power BI, Looker) the same data, click API Access and copy the endpoint, the key and the sample request.
The endpoint is read-only and returns this event's report as data.
Scheduled delivery
Schedule Report lets you choose a report, a format (PDF or Excel), recipients and a frequency (one-time, weekly after the event, monthly) and lists your saved schedules. At the time of writing Moostoo keeps those schedules but does not yet send them — export the report and send it yourself until automatic delivery arrives.
What attendees see
Attendees are not affected. The report is visible only to your team, and exporting it or sharing the API key sends nothing to attendees. Keep in mind that the Attendees export contains personal data — names, job titles, companies and engagement — so share it only with people who should have it.
Tips
- Wait until the finalizing banner is gone before exporting numbers you intend to publish.
- Attendance and drop-off come from session check-ins. An event that did not scan at room doors will report low attendance everywhere — see Credits & attendance and Session check-in.
- NPS Score reads Survey data pending until survey answers exist.
- The View Live Analytics link on the in-progress banner currently opens Pre-Event Analytics; use the Live Event tab instead.
- Benchmarking compares events of your whole organization. For a bigger picture across every event, use Organization analytics.
Ask Moostoo
For headline counts after the event, ask Moostoo instead of opening the report.
How many attendees did Northwind Summit end up with, by attendee type?